Unlocking Excel’s Potential and Using MarketXLS
MarketXLS Review
In an age of data-driven decisions, financial analysis tools have become indispensable for investors and analysts. One such tool that has garnered attention in recent years is MarketXLS. With the promise of simplifying stock market analysis using the familiar interface of Microsoft Excel, MarketXLS aims to bring a blend of simplicity and depth to its users. Here is a detailed review of the platform.
1. Functionality and Features of MarketXLS
At its core, MarketXLS allows users to pull real-time and historical stock data directly into Excel. But that’s just scratching the surface. The platform boasts:
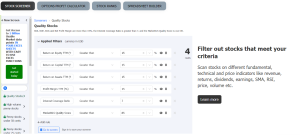
- Extensive Data Coverage: It covers not only stock prices but also fundamentals, options, dividends, and a host of technical indicators. This depth makes it suitable for both fundamental and technical analysts.
- In-Built Templates: For those unfamiliar with setting up financial models, MarketXLS provides pre-made templates for valuation, portfolio management, and more.
- Custom Functions: With over 100 custom Excel functions, users can construct their formulas leveraging the vast data sets available.
2. User Interface of MarketXLS
Being an Excel add-in, MarketXLS doesn’t deviate from the familiar interface of Microsoft Excel. For those accustomed to Excel, this ensures a negligible learning curve. The functions are well-documented and can be accessed easily.
However, while the Excel integration is its strength, it can also be a limitation for those who wish for a more visual and interactive interface like some modern web-based platforms.
3. Speed and Performance
Pulling data directly into Excel sheets is generally seamless, though the speed can sometimes be affected by the volume of data requested and the user’s internet connection. In most cases, however, the performance is satisfactory and doesn’t impede analysis.
4. Flexibility
MarketXLS shines in flexibility. Users can create custom screens, set alerts, and even integrate their own data sources if needed. This adaptability is particularly beneficial for advanced users with specific requirements.
5. Pricing
The platform operates on a subscription model. Given the range of features and data access it offers, many users might find the pricing reasonable. However, hobbyists or occasional investors might feel it’s on the pricier side.
6. Customer Support and Learning Resources
MarketXLS backs its software with an array of support resources. Their website has a wealth of tutorials, webinars, and a knowledge base to assist users. Customer support, from personal experience, has been prompt and helpful.
7. Integration and Compatibility
While it’s fantastic for Excel enthusiasts, non-Excel users might find it limiting. The platform is currently limited to Windows, which leaves out Mac and Linux users.
Conclusion
MarketXLS is a robust tool for those who love the versatility of Excel and want to supercharge it for financial analysis. With its comprehensive data access, custom functions, and pre-built templates, it brings a lot to the table for both novice and expert investors.
However, it’s essential to understand its core strength – being an Excel add-in. Those looking for flashy dashboards or a different interface might be left wanting. Furthermore, compatibility can be an issue for non-Windows users.
All in all, if Excel is your go-to for analysis and you’re looking to extend its capabilities specifically for stock market analysis, MarketXLS is worth considering. However, ensure it aligns with your needs and budget before diving in.
Hey there, finance enthusiasts! Ever wished your good ol’ Excel could give you real-time stock data? Well, I stumbled upon MarketXLS and thought it’s worth spilling the beans about. Here’s a casual take on what I think:
1. All the Good Stuff in One Place Imagine not having to juggle between apps to get stock data, fundamentals, or even dividends. MarketXLS brings it all into your Excel. It’s like giving your spreadsheet a superhero cape!
2. No More Template Hunting You know those hours spent searching for the perfect stock analysis template? Bid them goodbye! This tool has a bunch ready for you – from valuing a company to tracking your investments.
3. Custom Functions? Yes, Please! Over 100 custom Excel functions! It’s like discovering secret cheat codes for a game. Whether you’re building your formula or tweaking an existing one, there’s a lot to play with.
4. Feel Right At Home Because it’s Excel, there’s no awkward first date phase. You dive right in. But if you were hoping for flashy charts and visuals, remember, it’s all about harnessing Excel’s raw power here.
5. Quick and Mostly Smooth Fetching data feels like magic, mostly. Sometimes it takes a bit, especially if you’re asking for a lot. But hey, good data is worth a tiny wait.
6. A Bit of a Price Tag Okay, so it’s subscription-based. For the data and features, it makes sense. But if you’re just dabbling in stocks now and then, it might feel a tad heavy on the pocket.
7. Need Help? They Got You Ran into a snag? Their support team is pretty swift. Plus, there’s a treasure trove of tutorials and webinars on their site.
8. Compatibility… A Tiny Catch It’s an Excel party, but only for Windows folks. Mac and Linux users might feel a bit left out.
In a Nutshell… If Excel is your jam and you’re itching to amplify its stock analysis game, MarketXLS could be your new best friend. Just make sure it vibes with what you’re looking for and your budget. Happy analyzing! 📊🚀

Start Blogging 2022: How to Earn $100 Per Day in Passive Income in 2022

The Benefits of Hiring a Writer for Website Content